What is CIS?
CIS is an open source command-line tool for easy collocation, visualization, analysis, and comparison of diverse gridded and ungridded datasets used in the atmospheric sciences. Learn more
Step 1 Read your data
CIS comes with built-in support for a large variety of observational and model datasets. Users can make new datasets accessible for CIS through short pieces of Python code ("plug-ins").
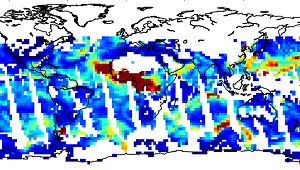
Step 2 Resample your data
CIS can subset and aggregate your dataset in time and space. It can also collocate it in time and space with any other dataset. Different collocation methods are available.
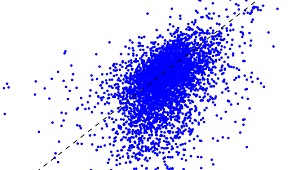
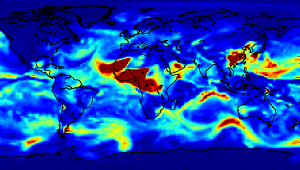
Step 3 Analyse your data
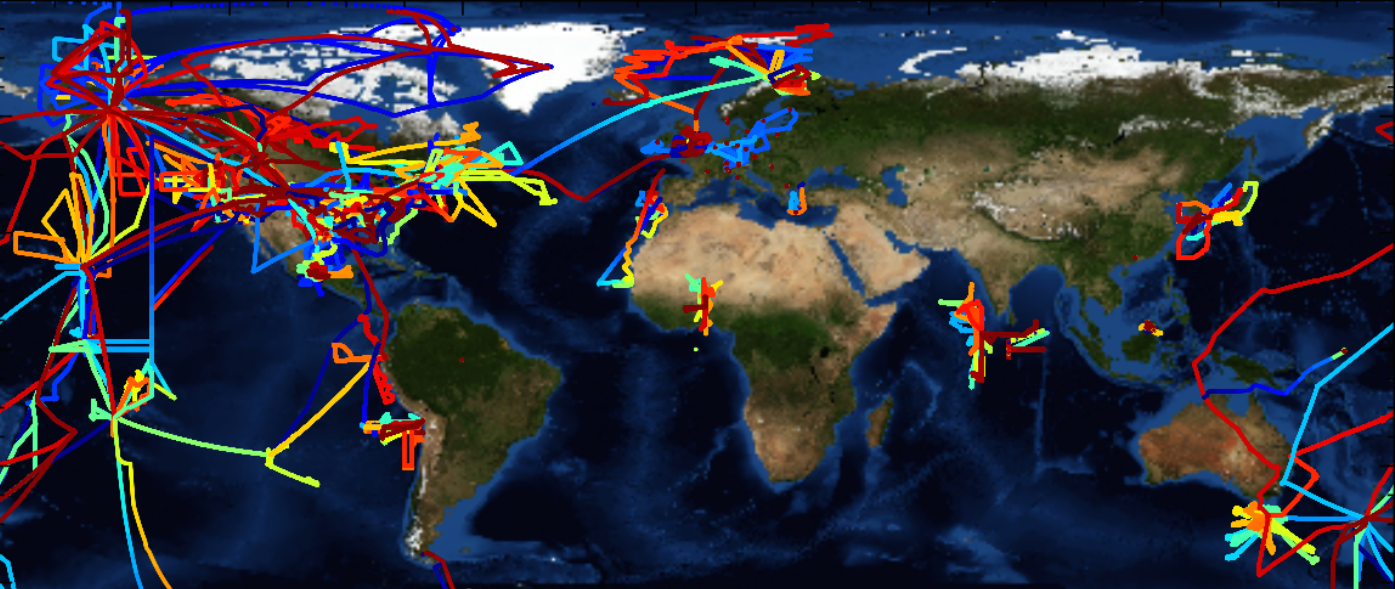
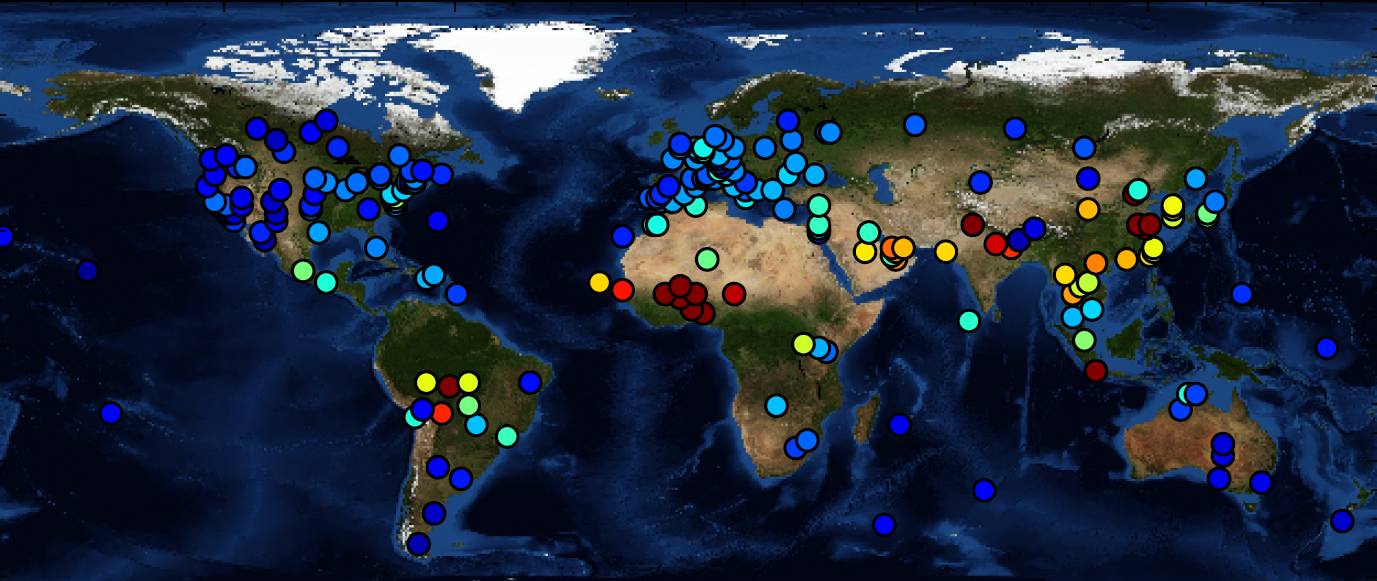
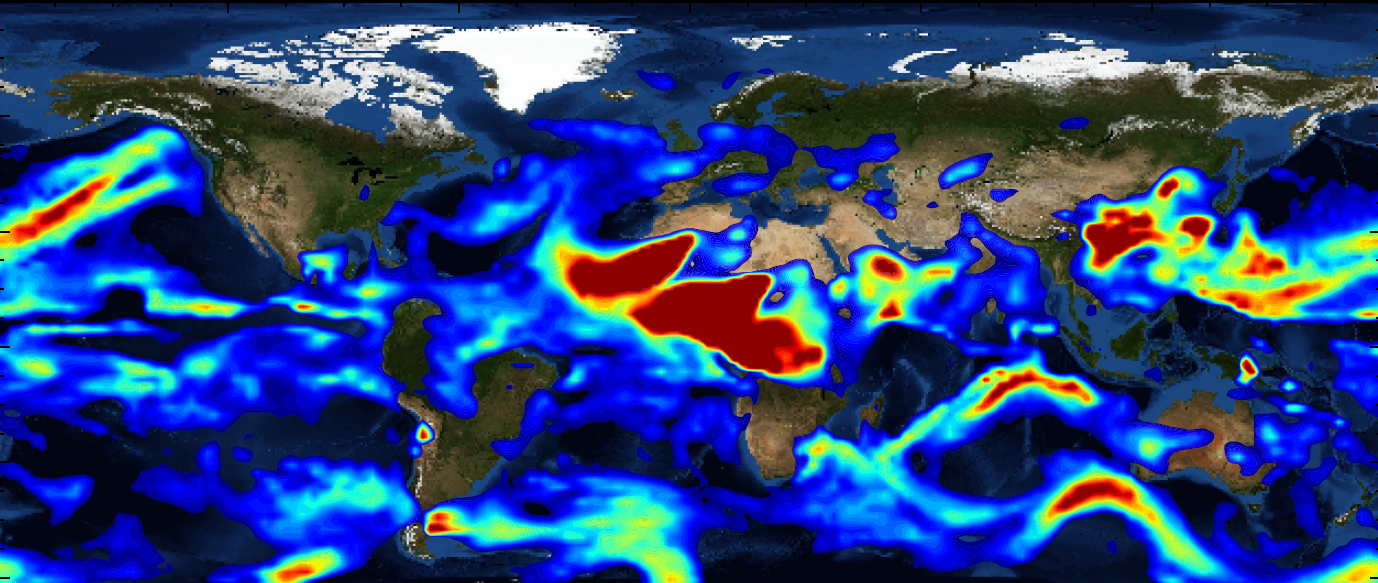
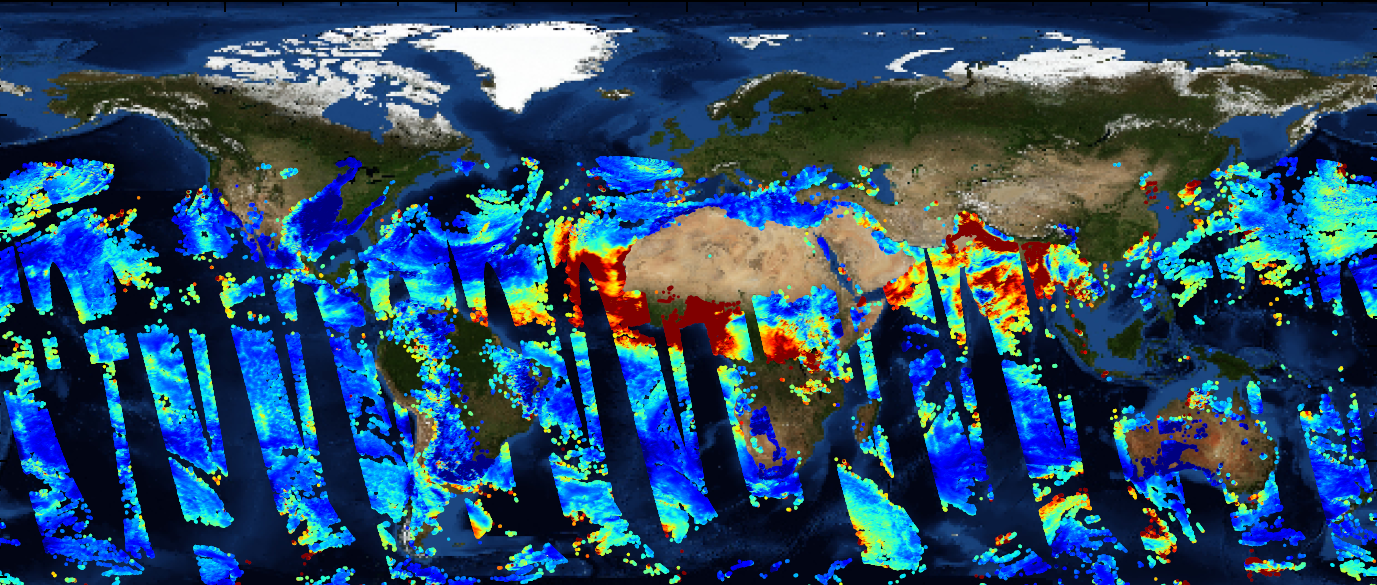
CIS can visualize your data in many ways and export to multiple file types. The tool also provides basic statistical analysis..
Homepage
Supported Data & Plugins
CIS can read data in many formats. In addition to the data types supported by the core product, additional data types can be supported by the use of plugins. Supported data types include satellite data, ground sites, model data, and flight campaigns.
Support & Partners